Multispectral Imaging
Description
Principle
Multispectral imaging is defined as the acquisition of the same image in several wavelength regions. In our case, it would consist of recording the image of the painting in the ultraviolet (UV), visible (VIS), and infrared (IR) regions of the electromagnetic spectrum. The images can be the usual reflexive images or they can also be recorded in transmission where the light which passes through the painting is recorded. Some pigments or other painting materials such as varnishes are known to send out (emit) light after having been illuminated with UV, visible or infrared radiation. This radiation is called fluorescence and it can be recorded and used in multispectral imaging.
Spectral Regions
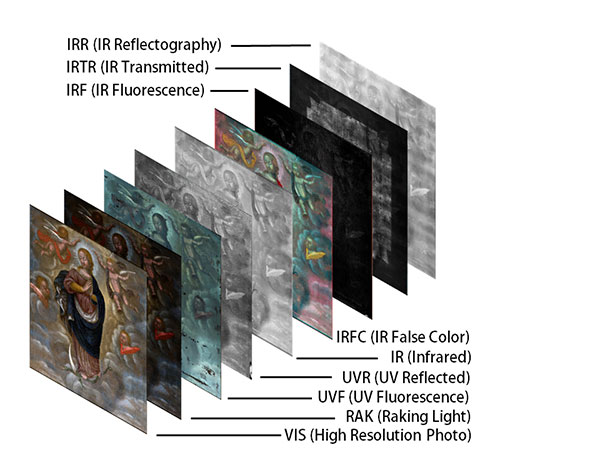
VIS—Visible light. This is the usual colour photograph of the painting serving as the reference for the other images.
VISTR—Visible Transmitted. The painting is illuminated by visible light and the transmitted light is recorded on the other side of the painting. It allows a better separation of paint layers and can make later alterations more visible.
RAK—Raking light. The painting is illuminated from the side at a very shallow angle. The craquelure and surface appearance become more distinguishable.
UVF—Ultraviolet Fluorescence. The painting is illuminated by ultraviolet radiation and the resulting fluorescence is recorded. Varnishes and retouching become visible in this manner.
UVR—Ultraviolet Reflected. The painting is illuminated by ultraviolet radiation and the reflected UV radiation is recorded.
IRR—Infrared Reflectography. The painting is irradiated by infrared radiation and the reflected radiation is recorded. IR-radiation penetrates the surface layers of the painting and the underdrawing becomes visible.
IRFC—Infrared False Color. is created by combining a visible picture and an infrared picture, thus making it possible to observe the different materials and retouches in the false color image.
IRF—Infrared Fluorescence. The painting is illuminated by visible or infrared rays and the resulting fluorescence in the infrared region of the spectrum is recorded. Some pigments such as cadmium yellow fluoresce in the infrared region and can be detected in this manner.
IRTR—Infrared Transmitted. The painting is irradiated by infrared radiation and the transmitted radiation on the other side of the painting is recorded. It gives in some cases a better visual representation of underdrawings and alterations.
Video: 'Scanning the Mona Lisa with multispectral camera' by Pascal Cotte
Procedure
Instruments
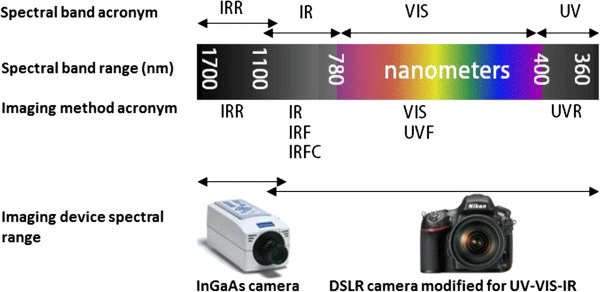
Images in the visible light can be recorded by a high-quality digital camera. The camera for the recording of UV and near-IR images has to be adapted by removing the UV and IR filters that are placed on the sensor in consumer cameras. Special infrared-sensitive cameras have to be used for recording longer wavelengths of radiation (1).
References
(1) Antonino Cosentino, Identification of pigments by multispectral imaging; a flowchart method, Heritage Science 2014, 2:8. Available as pdf.
Video: 'Multispectral Imaging' by A. Cosentino
Examples of Use
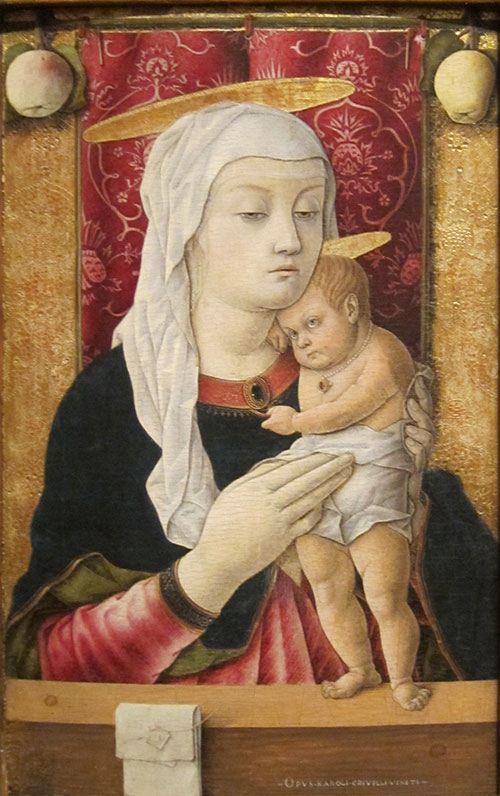
Carlo Crivelli, Madonna and Child, ca 1468
The painting is located in the San Diego Museum of Art. The very thorough investigation by multispectral imaging revealed a whole series of deep insights into the working method of this less known renaissance master.
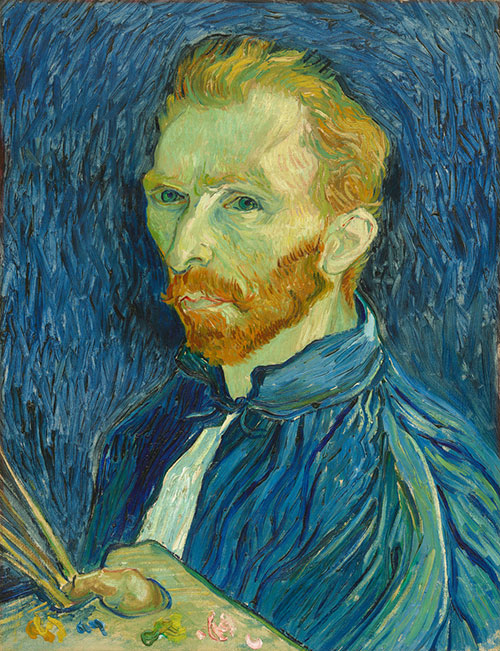
Vincent van Gogh, Self-portrait, 1889
Painting in the collection of The National Gallery of Art, Washington.
Francisco H. Imai, Mitchell R. Rosen and Roy S. Berns, Multi-spectral imaging of van Gogh’s Self-portrait at the National Gallery of Art, Washington, D.C., IS&T’s 2001 PICS Conference Proceedings.
Paintings by Edvard Munch
R. Belluci, C. Daffara, C. Frosini, C. Miliani, M. Patti and B. Topalova-Casadiego, Analysis of Munch’s paintings by scanning multispectral infrared reflectography: Anxiety (1894), Puberty (1894) and Vampire (1895)”, Proceedings from the Munch 150 Conference, Munch Museum and the University of Oslo, 2013. Available as pdf.
A. Cosentino, Edvard Munch. Technical Art Examination, website CHSOS.
A. Cosentino, E. Munch Multispectral Documentation in Norway, “The Deathbed”, Béhance website.
a) Hilda Deborah, Sony George, Jon Yngve Hardeberg, Pigment Mapping of the Scream (1893) Based on Hyperspectral Imaging, Volume 8509 of the series Lecture Notes in Computer Science pp 247-256.
b) Hilda Deborah, Sony George, and Jon Yngve Hardeberg, Pigment mapping of The Scream (1893) based on hyperspectral imaging, Presentation of The Norwegian Colour and Visual Computing Laboratory. Available as pdf.
See also The Scream on this website.
Identification of Individual Pigments
1. Flowchart Method for Identification of Pigments
Antonino Cosentino, Identification of pigments by multispectral imaging; a flowchart method, Heritage Science 2014, 2:8. Available as pdf.
A. Cosentino, Filter set for Technical Photography, the website of chsopensource.org.
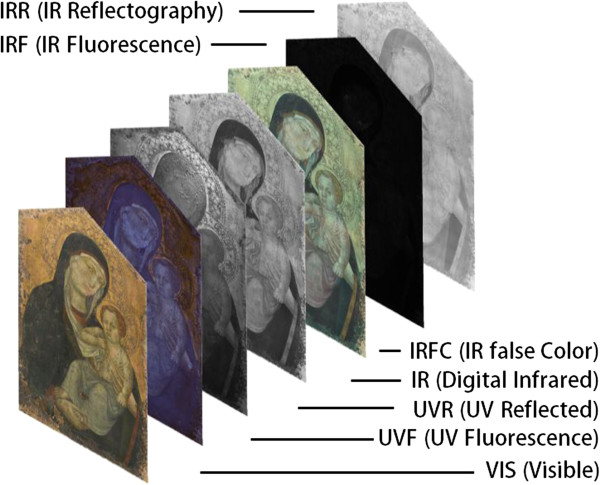
A. Cosentino developed a flowchart method for identification of individual pigments utilizing a multitude of imaging methods in the spectral region between around 250 nm (ultraviolet), UV and up to around 1700 nm (infrared, IR). The images can be obtained by registering reflected light in the IR, visible (VIS) or IR region of the electromagnetic spectrum. In another group of methods, the painting is illuminated by appropriate radiation (again UV, VIS or IR) and the fluorescence can be recorded instead of the reflected light. Fluorescence is the ability of certain materials (pigments) to send out radiation after having been illuminated by higher energy rays. The images below show the employed methods in this investigation. The filters necessary for each of the above methods are described in the second reference above.
Madonna and Child, Ingels Collection, Sweden
(c) A. Cosentino
2. Identification of Blue Pigments
John K. Delaney, Elizabeth Walmsley, Barbara H. Berrie, and Colin F. Fletcher, Multispectral Imaging of Paintings in the Infrared to Detect and Map Blue Pigments, In: Sackler NAS Colloquium, Scientific Examination of Art: Modern Techniques in Conservation and Analysis (2005), pp. 120-136. Available as pdf.
The scientist employed infrared spectroscopy (IR) in the wide range of wavelength to identify blue pigments in a painting by Vincent van Gogh.
Abstract from the above publication
“In this paper spectral imaging in the reflective infrared (IR) spectral region (0.7 to 2.5 microns) is examined for its potential to discriminate and identify blue pigments in paintings. The blue pigments considered are azurite, indigo, Prussian blue, cobalt blue, ultramarine, and phtalocyanine blue. The blue areas in this painting by Van Gogh have been investigated by the authors and the pigments identified as prussian blue and artificial ultramarine.”
Multispectral Imaging in the Library
Bitstreams: Duke University Libraries blog. Application of Multispectral imaging in the investigation of old manuscripts.
Further Reading
References
(1) Antonino Cosentino, Identification of pigments by multispectral imaging; a flowchart method, Heritage Science 2014, 2:8. Available as pdf.
(2) Yonghui Zhao, Roy S. Berns, Lawrence, A. Taplin, James Coddington, An Investigation of Multispectral Imaging for the Mapping of Pigments in Paintings. In Computer Image Analysis in the Study of Art, edited by David G. Stork, Jim Coddington, Proc. of SPIEIS&T Electronic Imaging, SPIE Vol. 6810, 681007, © 2008. Available as pdf.
(3) Philippe Colantoni, Ruven Pillay, Christian Lahanier and Denis Pitzalis, Analysis of Multispectral Images of Paintings, 14th European Signal Processing Conference (EUSIPCO 2006), Florence, Italy, September 4-8, 2006. Available as pdf.
(4) S. Baronti, A. Casini, F. Lotti, and S. Porcinai, Multispectral imaging system for the mapping of pigments in works of art by use of principal-component analysis, Applied Optics Vol. 37, Issue 8, pp. 1299-1309 (1998). doi: 10.1364/AO.37.001299.
(5) Stijn Legrand, Frederik Vanmeert, Geert Van der Snickt, Matthias Alfeld, Wout De Nolf, Joris Dik and Koen Janssens, Examination of historical paintings by state-of-the-art hyperspectral imaging methods: from scanning infra-red spectroscopy to computed X-ray laminography, Heritage Science 2014, 2:13, https://doi.org/10.1186/2050-7445-2-13

